


The 60th anniversary of USTER STATISTICS highlights remarkable increases in quality expectations worldwide.
It all started as three pages in the German textile magazine Melliand in 1957. Today, the global benchmarks known as USTER STATISTICS have legendary status throughout the industry as an objective measure of quality.
This article marks the 60th anniversary of USTER STATISTICS ? six decades of a unique and free benchmarking service for the textile field. Their development over the decades provides a reliable monitor of how quality demands in textiles have increased. For example, a typical yarn with a 50 per cent quality rating back in 1964 would need to register much better evenness to reach the same level half a century later. This comparison is made using USTER STATISTICS Percentiles for comparing the quality of spinning mills worldwide. Looking ahead, the ongoing expansion of USTER STATISTICS will continue with the inclusion of many more quality parameters such as Hairiness Length Classification in the 2018 edition.
Spinners themselves were behind the origins of USTER STATISTICS in the 1950s, as they saw the benefit of benchmarking their yarn quality against competitors in other mills. USTER had earlier introduced the first yarn evenness tester in 1948, and was therefore an obvious choice to answer the spinners? request. This led to the publication of the so-called USTER STANDARDS, the forerunner of USTER STATISTICS, which listed only unevenness data as U% and CV figures for carded and combed yarn.
From cotton to blends
Evenness remains one of the essential quality standards for the industry today ? although the number of other yarn parameters now measured has grown over time, in line with the launch of further USTER instruments for yarn quality improvement. By 1997, standards for fibres were added, based on the USTER AFIS. The statistical data has also become much more comprehensive, extending to take in a wider range of fibre materials, including wool, viscose, polyester and even blends.
In 1957, USTER STANDARDS included just three quality parameters, contained in two chapters across only six pages, including six graphs. The latest 2013 edition of USTER STATISTICS covers 101 quality parameters in 123 chapters, using over 2,500 graphs. ?The standards are far more than figures to compare yarn quality around the world,? says Gabriela Peters, Product Manager Yarn Testing within Uster Technologies. ?USTER STATISTICS have become a common language of quality for yarn producers and yarn users.?
The famous red lines?
USTER STATISTICS Percentiles (USP) were introduced in 1965 ? and today everybody in the industry recognises the familiar red lines, indicating values for a 5 per cent, 25 per cent, 50 per cent, 75 per cent and 95 per cent standard. The USP figure is a rating for a particular parameter, based on comparisons with the quality level being produced by mills worldwide.
Today yarns are often spot-market internet purchases. Missing specifications based upon objective values lead to a serious deterioration in the quality of garments or other textile products that is why also leading yarn traders insist on clear specifications for yarns and USTER STATISTICS offer the references. The famous red lines show their relevance along the textile value chain. USTER STATISTICS actually bridges the gap between yarnproducers and yarn users, enabling them to talk about quality in a way that is understood by all.
The change in evenness
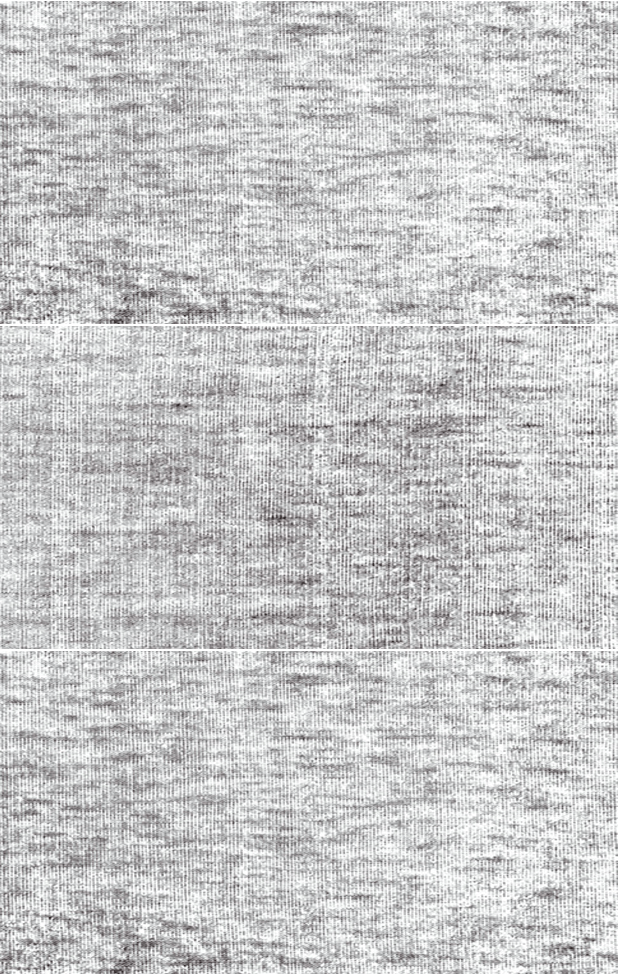
Standards for evenness testing have been available for 60 years and it is interesting to note how much the values behind this standard have improved. The evenness of yarns has become better and better over the long term (see graph). Taking a typical ring-spun yarn of 100 per cent combed cotton, 20 tex (Ne 30), a USP rating of 50 per cent could be achieved in 1964 with a CVm of 15.2. To be at the same level, a similar yarn in 2013 would have required a CVm value of 12.6 (shown by the red line in the graph). This changing requirement is clearly shown by comparing fabrics made from yarn with these parameters (see photos).
Sample A, with a USP 50 per cent value for CVm in 1964, exhibits a much more ?cloudy? appearance than Sample B, which would have rated a USP value of 50 per cent for CVm 49 years later. The fabric in Sample A demonstrates that the yarn used would be regarded as much less acceptable under today?s increased quality expectations.
This trend underscores the fact that customers over the years have become more and more demanding about yarn evenness, in tandem with the quality improvements made possible by the technological progress in spinning machinery. At the same time, the evenness testing instrument has become much more sophisticated ? with advanced technology and sensors now providing the most accurate testing results. With the essential support of USTER STATISTICS as a tool for daily testing routines, the latest-generation USTER TESTER 6 is the ultimate in user-friendly and intelligent quality assurance. Its integration of all test data enables the automatic production of quality reports with a clear presentation of the USP values.
The one and only
What makes USTER STATISTICS unique is the fact that no other company has attempted to establish its own system of collating and publishing textile quality standards. The Statistics will be continuously developed in the future ? with an important addition already planned for the next edition in 2018 to include hairiness length values measured by the new HL sensors, launched with USTER TESTER 6.
The entire textile chain ? yarn producers, their customers downstream, as well as traders and machine manufacturers ? acknowledge that USTER STATISTICS has played a key part in establishing the USTER name as a synonym for quality standards in the textile industry. ?I congratulate Uster Technologies on the 60th anniversary of USTER STATISTICS and I pay tribute to the company?s achievements in setting the standards we all use in our routines,? says SP Oswal, Chairman, Vardhaman Textiles Ltd.
Literally, USTER STATISTICS are the only way to compare yarn quality objectively ? and the textile industry can depend on their continued assistance for the next 60 years and beyond.
The Uster Group is the leading high-technology instrument manufacturer of products for quality measurement and certification for the textile industry. The Group provides testing and monitoring instruments, systems and services that allow optimisation of quality through each individual stage of textile production. This includes raw textile fibres, such as cotton or wool, all staple fibre and filament yarns, as well as downstream services to the final finished fabric.
The Uster Group provides benchmarks that are a basis for the trading of textile products at assured levels of quality across global markets. The Group?s aim is to forward know-how on quality, productivity and cost to the textile industry. The Group is headquartered in Uster, Switzerland and operates through a worldwide Market Organization complemented by Technology Centers. It has sales and service subsidiaries in the major textile markets in Uster (Switzerland), Knoxville (USA) and Suzhou (China).